
dataZoa for University Libraries
As Reported by the Wall Street Journal (May 7, 2013):
"On Twitter you can follow this or that person and with dataZoa you can follow numbers"
McKinsey: "Open data can help unlock $3 trillion to $5 trillion in economic value annually across seven sectors"
(Click through above link to read McKinsey article)
dataZoa for University Libraries: Fulfilling the Promise of Open Data with over 3 billion data series
Mining the Open Data riches of the Web is an essential:
- Knowledge Domain
- Job-getting skill for today's students
- Productivity booster; for course work, research, grant applications, and more
For the first time in history, everyone, from young students to the highest decision-makers, has access to the actual information by which businesses and governments, large and small, make their decisions and set their policies.
The promise of Open Data is that we can all independently consider, evaluate, and draw conclusions from the same data.
Before dataZoa, the actual practice of using this diverse data was time-consuming, messy and painful. A major portion of time was wasted on "data drudgery"; cleaning, aligning, pasting, re-typing and such. All before any real thought or analysis could begin.
datazoa's Mission is to Erase the Pain and Fulfill the Promise of Open Data
Some examples of dataZoa Supporting the University Library Mission:


Over 1,400,000 students, faculty and staff of US universities already have access to dataZoa.
dataZoa delivers:
- Marketable Skills (for instance...)- students deliver immediate, useful results to employers by using real-world data
- Health Cost Analysis - Procedure, DRG and Diagnosis Data, with Costs and Outcomes stratified by Demographics
- Site Selection for Factories, Call Centers and other facilities - Using OES data from BLS
- Regional Comparisons - with economic data published at dataZoa University Data Centers
- Market Sizing and Unit Placement - Zip Code level for Businesses; Census Tract level for Consumer Markets
- Energy Purchasing - pricing, production and markets by energy source, from EIA and Non-US sources
- Bank Acquisition Evaluation with FFIEC Data; every US Bank depicted in exquisite detail
- Develop Emerging Market investment strategies - Global Central Bank data and National Stats Office data
- Investment Analysis - Sec EDGAR Filings as time series, stock prices, currency rates
- Real Estate and Construction Project Sizing - Zillow, Case-Schiller, Census Building Permits and more
- Commodity Forecasting - Agriculture Price and Production Data from USDA, weather from NOAA
- Resource Allocation for Education - National Center for Education Statistics
- Intellectual Property - US Patent Office Data for US and non-US companies
- Criminal Justice Monitoring - combining FBI UCR Crime Data, Census demographics, regional economic data
- International Benchmarking - using sources like OECD, World Bank, UN Data, BIS, ECB, ASEAN Nations and more
- Innovative Possibilities - intermix Primary Sources of data seamlessly, (for instance...)
- Bank of China credit rates + Port of Los Angeles container counts = 'International Policies with Local Impact'
- USDA crop totals + NOAA weather trends + Bank of England currencies = 'Food Security, Climate, and Finance'
- Students and faculty spend time on data analysis rather than data drudgery
- Analysis stays relevant because data is always current (vs. stale case studies)
- Results can live in many places at once; course materials, term papers, websites, blogs, tablets, smartphones. Always synchronized, automatically.
dataZoa is:
- A universal access

 tool for primary sources of open data
 - A growing ecosystem

 of inter-connected data
 - A private data transmission

 tool to instantly send/share data among colleagues, research staff and sponsors
 - A collaborative workspace to:
- Drag: Gather Data from authoritative sources
- Build: Analyze with calculations and displays
- Share: Present public data combined with private data and analysis


Let's Look at Drag, Build and Share in more detail:
1. Drag: Gather Data from authoritative sources
Below is an image captured from the home page of the BLS (Bureau of Labor Statistics),
showing dataZoa's unique, patent-pending browser add-on, the  dZ-Dot™.
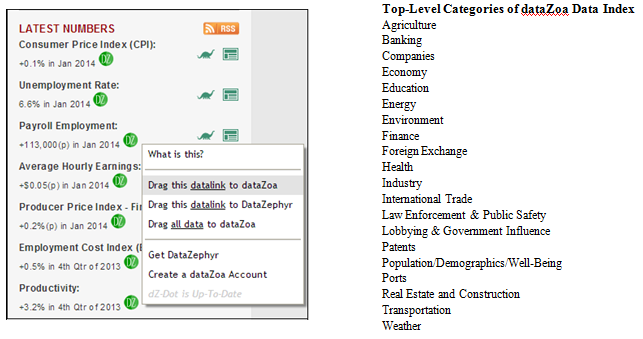
The dZ-Dot indicates that the data it sits next to are live, updating series. It permits anyone on campus to drag and drop these dynamically updating series into their dataZoa account.
Above and to the right are the top-level categories of the dataZoa Data Index.
- The dataZoa topic index leads to the billions of data series marked by the dZ-Dot.
- This 90-second video
 shows the dZ-Dot in action.
 -
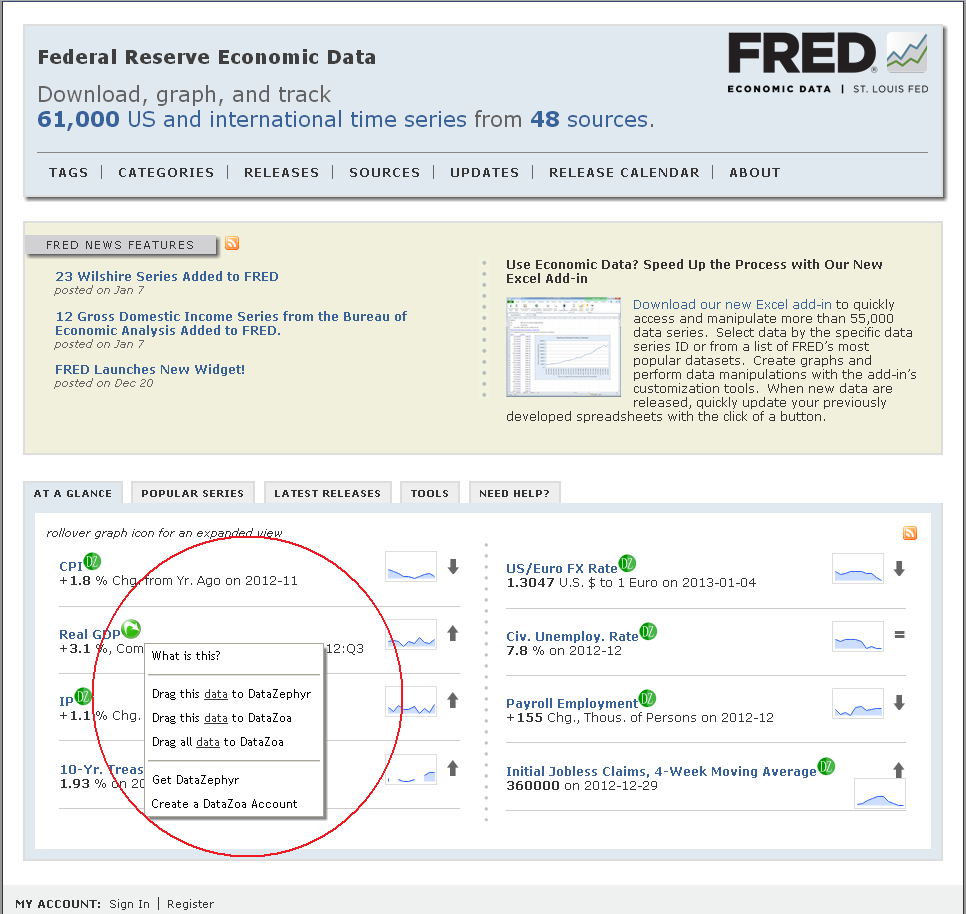
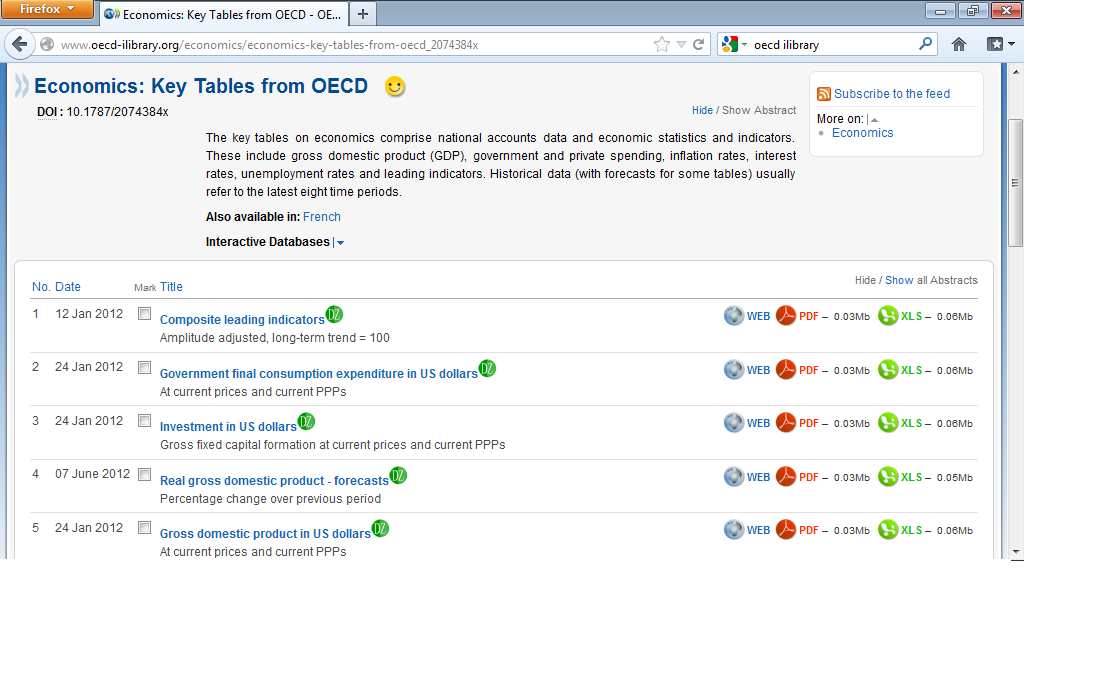
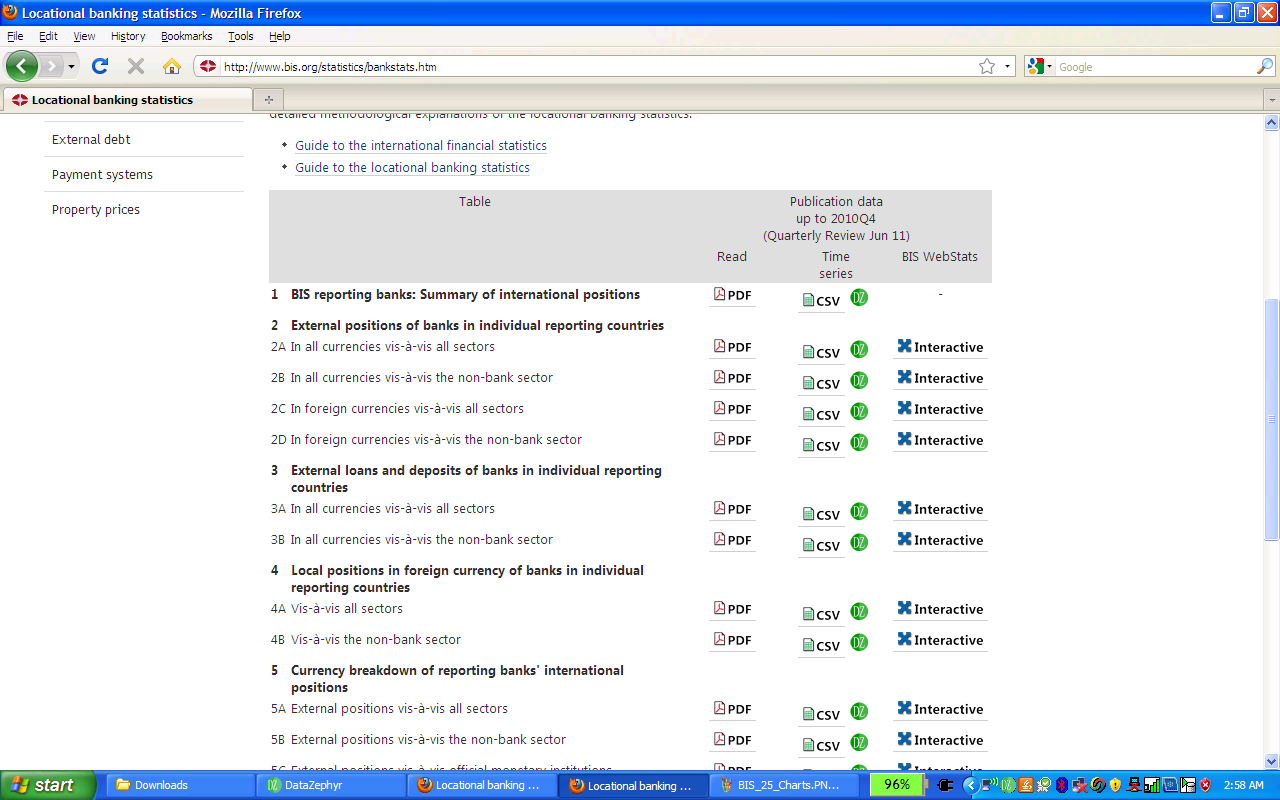
These screenshots show the dZ-Dot in placeat various important sites around the Web...
-
and here are some highlights of data sourcesby area...
Select U.S. and International Sources for Economic and Social Information:
BLS (all sections incl. OES) BEA (all interactive tables) Housing Permits and Starts (US Census) St. Louis FED (FRED) EIA (Oil & Gas) Weekly Unemployment Claims (DOL) US Census LEHD (QWI Online) Bank of England (Statistics) US Census Business & Industry (Database Search) OECD iLibrary (Key Tables) ECB (Statistical Data Warehouse) BIS (Statistics) World Bank Data FBI Uniform Crime Report County Business Patterns (US Census) TANF (Caseload & Applications) Census SAIPE Data (State, County & School Districts) Census SAHIE Data (State & County) Housing Vacancies & Homeownership (CPS/HVS - Census) Board of Governors of the Federal Reserve System IRS Migration (State & County) USDA Quickstats American Factfinder (Select Tables) SEC Edgar 10-Ks Chicago Fed Port of Los Angeles Private Data Sources - Economic and Social Information*:
Kids Count (State level data) Zillow (Local Market Indexes) MSCI Market Indexes (Regional and Sector) Yahoo Finance Historical Price/Index Data Swiss Fund Data *May require owner permission for republication
A Sampling of International Data Sources:
UNData (All sections) Swiss Federal Statistics (STAT-TAB) Swiss National Bank UN ECE Statistics Sweden Statistics Norway (StatBank) Statistics Ireland (StatBank) Statistics Iceland Statistics Estonia (Database) INSEE - France (Databases) DansmarkNationalbank (Statistical Database) Deutsche Bundesbank (Statistics - All Time Series) Banque de France (Webstats) Stats Canada Some U.S. Sources of Interest to Health Care Professionals and Health Economists:
`CDC Behavioral Risk Factors (MSA Level Data) CDC BRFSS (State Trend Data) HCUPnet State Trend Data (by DRG, IDC-9-CM and CCS) National Cancer Institute State Profiles (Trend Data)
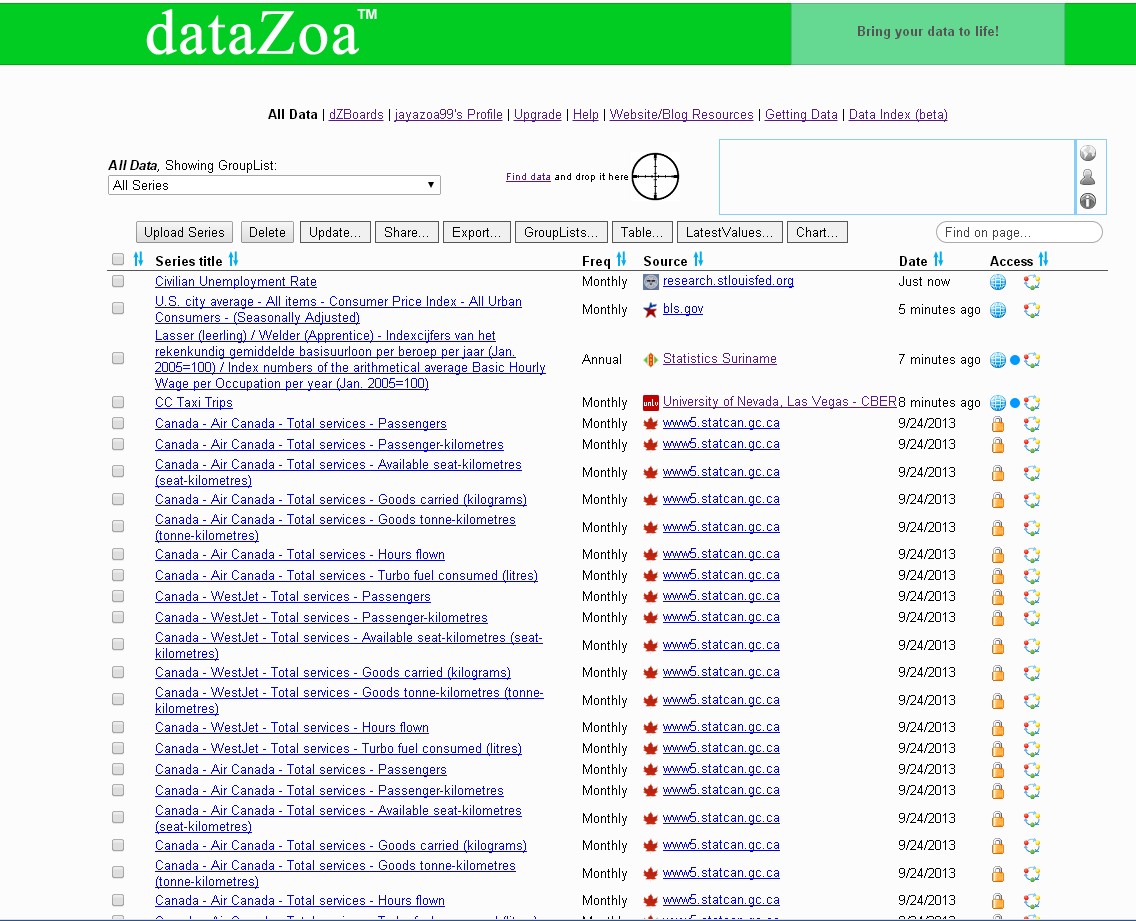
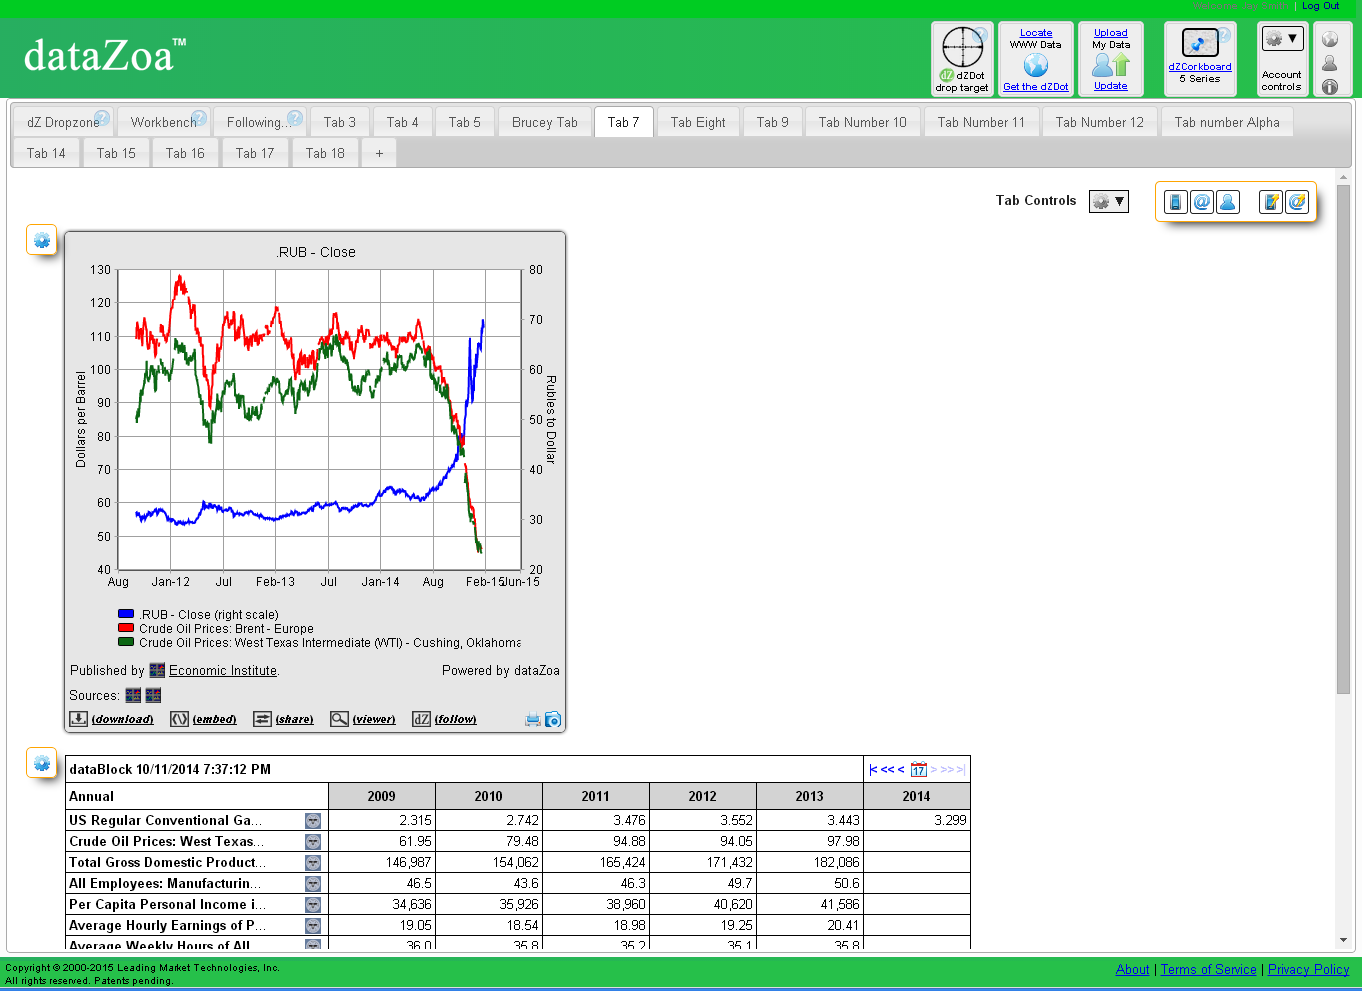
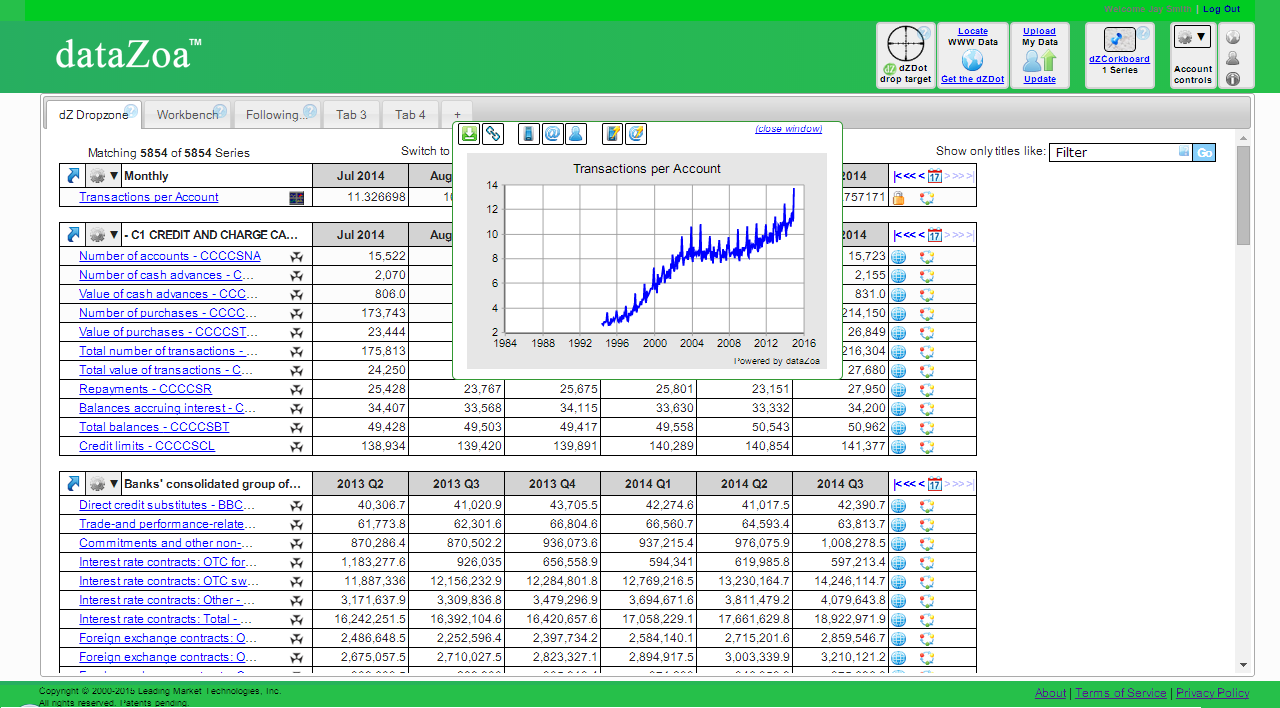
To pull it all together, here are a couple of screenshots of Web data at home in a dataZoa account:
| dataZoa workbench | dataZoa chart, dataBlock, Tab |
 shows you how uploading works.
2. Build: Unique Calculations and Displays...
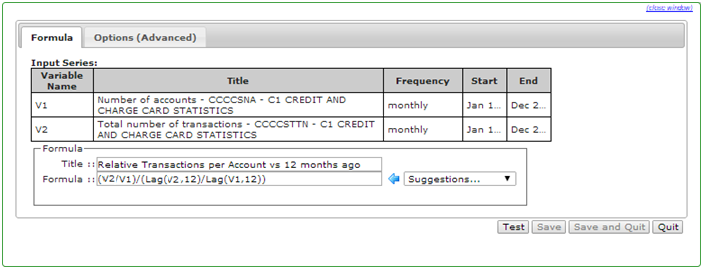
Calculations: Unique new data series with dataZoas Computecloud™
Below is a ComputeCloud example from the Reserve Bank of Australia, incorporating a 12-month lag calculation:
This two minute video shows the ComputeCloud in action.
Displays: Build Vivid, Embeddable Charts and Tables for Display
Below is an example highlighting some unique features of a dZ dataBlock™ display:

Examples of dataZoa displays on duty around the Web....
University of Nevada Las Vegas
University of Arizona
Massachusetts Treasury
University of Wisconsin, River Falls
Ball State CEBR
Bank of Jamaica
There's much more to know about dataZoa displays:
- dataZoa has several rich display types...
- Tables: Recent values for a set of series, shown numerically
- Charts: Lines, Bars, Pie, Errorbars, Scatters, etc...
- dataBlocks: Grouped series that can scroll back and forth through time together
- Latest Values: The most recent values for a set of series, including percent changes, etc.
- dataZoa displays are tools; far more than pretty pictures...
- Click on any data row to see a full historical chart
- Download all data behind a table
- Embed a display with a simple link
- Share then with social networking tools
- Mirror a table as a live spreadsheet on user's desktop in EXCEL
- Drag and drop individual data series into the free DZ-Viewer for viewing and analysis
- Follow the series or table in another dataZoa end-user account
- This video shows display building in action.
3. Share: Present Your Work to Colleagues or the World at Large
You can share a variety of different elements in dataZoa:
- Individual displays - send a chart or a table here or there
- Data series - the inputs behind the displays
- Collections ("dZBoards") - narrative data, displays and multi-media commentary
Using a variety of techniques, as appropriate:
- Embed links - for e-papers, blogs, websites, resumes, CVs
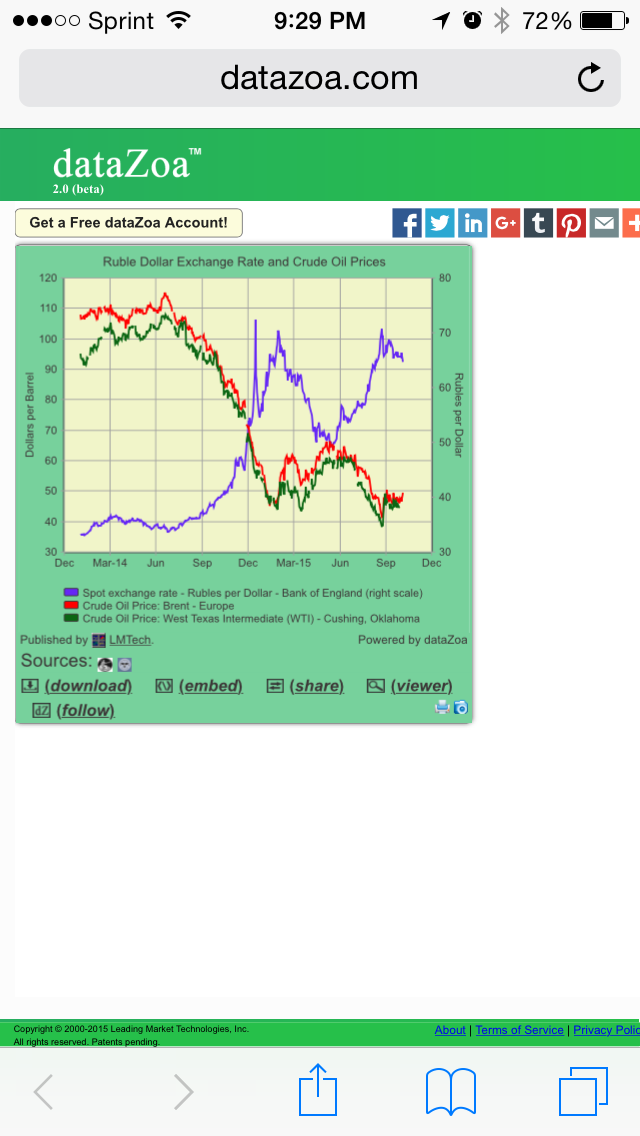
- SMS - send a chart right to a smart phone or tablet, even tack it to the home screen
- Email - simple to send, receive, and pass along
- Following - link data and displays between accounts in the dataZoa ecosystem
- Explicit sharing by permission - for managed collaboration among dataZoa accounts
And when you combine these possibilities in practice:
- Professors can share a curated dataset privately with students
- Students can email a quick chart to professors and ask questions
- Researchers in different locations can use dataZoa as a common data repository
- Data-driven papers can be presented entirely wthin in a dZBoard
- A graduate can pull up dZ-driven work on a smartphone in the middle of an interview
- A dZChart, via SMS
- Emailing a chart
- A dZBoard - California Energy
- A multimedia dZBoard - State of Maine
Some sample projects:
Heart Attack Outcomes Related to Type of Insurance
Strength of the Ruble and World Oil Prices
Lobbying Expenditures and the Supply of US Physicians
A Job Search Analysis
Importantly, since dataZoa automatically updates, the data, calculations and displays reflect the real-time state of the world.
Getting dataZoa for your campus
How does a datazoa subscription work?
- Single low-priced annual subscription
- Licensed campus wide, based solely on access to your ".edu" domain
- Flat rate for entire campus
- All-inclusive - no upcharges for data or usage
- Unlimited Student-level accounts
- Training
- Webinars
- Self-guided videos for dataZoa and various data sources
- Telephone support as needed
- Turn-key Deployment Kit for your Library Web Pages
- Fulsome descriptions of dataZoa's capabilities
- Drop-in self-serve links for creating accounts
- Keyword list for catalog search engine, linking dataZoa to relevant databases and subject areas
Leading Market Technologies, Inc., Company Information Links:
Company Home Page
Key Company Milestones
Below is a ComputeCloud example from the Reserve Bank of Australia, incorporating a 12-month lag calculation:
This two minute video shows the ComputeCloud in action.
Displays: Build Vivid, Embeddable Charts and Tables for Display
Below is an example highlighting some unique features of a dZ dataBlock™ display:
Examples of dataZoa displays on duty around the Web....
University of Nevada Las Vegas
University of Arizona
Massachusetts Treasury
University of Wisconsin, River Falls
Ball State CEBR
Bank of Jamaica
There's much more to know about dataZoa displays:
- dataZoa has several rich display types...
- Tables: Recent values for a set of series, shown numerically
- Charts: Lines, Bars, Pie, Errorbars, Scatters, etc...
- dataBlocks: Grouped series that can scroll back and forth through time together
- Latest Values: The most recent values for a set of series, including percent changes, etc.
- dataZoa displays are tools; far more than pretty pictures...
- Click on any data row to see a full historical chart
- Download all data behind a table
- Embed a display with a simple link
- Share then with social networking tools
- Mirror a table as a live spreadsheet on user's desktop in EXCEL
- Drag and drop individual data series into the free DZ-Viewer for viewing and analysis
- Follow the series or table in another dataZoa end-user account
- This video shows display building in action.
3. Share: Present Your Work to Colleagues or the World at Large
You can share a variety of different elements in dataZoa:
- Individual displays - send a chart or a table here or there
- Data series - the inputs behind the displays
- Collections ("dZBoards") - narrative data, displays and multi-media commentary
Using a variety of techniques, as appropriate:
- Embed links - for e-papers, blogs, websites, resumes, CVs
- SMS - send a chart right to a smart phone or tablet, even tack it to the home screen
- Email - simple to send, receive, and pass along
- Following - link data and displays between accounts in the dataZoa ecosystem
- Explicit sharing by permission - for managed collaboration among dataZoa accounts
And when you combine these possibilities in practice:
- Professors can share a curated dataset privately with students
- Students can email a quick chart to professors and ask questions
- Researchers in different locations can use dataZoa as a common data repository
- Data-driven papers can be presented entirely wthin in a dZBoard
- A graduate can pull up dZ-driven work on a smartphone in the middle of an interview
- A dZChart, via SMS
- Emailing a chart
- A dZBoard - California Energy
- A multimedia dZBoard - State of Maine
Some sample projects:
Heart Attack Outcomes Related to Type of Insurance
Strength of the Ruble and World Oil Prices
Lobbying Expenditures and the Supply of US Physicians
A Job Search Analysis
Importantly, since dataZoa automatically updates, the data, calculations and displays reflect the real-time state of the world.
Getting dataZoa for your campus
How does a datazoa subscription work?
- Single low-priced annual subscription
- Licensed campus wide, based solely on access to your ".edu" domain
- Flat rate for entire campus
- All-inclusive - no upcharges for data or usage
- Unlimited Student-level accounts
- Training
- Webinars
- Self-guided videos for dataZoa and various data sources
- Telephone support as needed
- Turn-key Deployment Kit for your Library Web Pages
- Fulsome descriptions of dataZoa's capabilities
- Drop-in self-serve links for creating accounts
- Keyword list for catalog search engine, linking dataZoa to relevant databases and subject areas
Leading Market Technologies, Inc., Company Information Links:
Company Home Page
Key Company Milestones
Below is an example highlighting some unique features of a dZ dataBlock™ display:
Examples of dataZoa displays on duty around the Web....
| University of Nevada Las Vegas | University of Arizona | Massachusetts Treasury |
| University of Wisconsin, River Falls | Ball State CEBR | Bank of Jamaica |
There's much more to know about dataZoa displays:
- dataZoa has several rich display types...
- Tables: Recent values for a set of series, shown numerically
- Charts: Lines, Bars, Pie, Errorbars, Scatters, etc...
- dataBlocks: Grouped series that can scroll back and forth through time together
- Latest Values: The most recent values for a set of series, including percent changes, etc.
- dataZoa displays are tools; far more than pretty pictures...
- Click on any data row to see a full historical chart
- Download all data behind a table
- Embed a display with a simple link
- Share then with social networking tools
- Mirror a table as a live spreadsheet on user's desktop in EXCEL
- Drag and drop individual data series into the free DZ-Viewer for viewing and analysis
- Follow the series or table in another dataZoa end-user account
- This video shows display building in action.
3. Share: Present Your Work to Colleagues or the World at Large
You can share a variety of different elements in dataZoa:
- Individual displays - send a chart or a table here or there
- Data series - the inputs behind the displays
- Collections ("dZBoards") - narrative data, displays and multi-media commentary
Using a variety of techniques, as appropriate:
- Embed links - for e-papers, blogs, websites, resumes, CVs
- SMS - send a chart right to a smart phone or tablet, even tack it to the home screen
- Email - simple to send, receive, and pass along
- Following - link data and displays between accounts in the dataZoa ecosystem
- Explicit sharing by permission - for managed collaboration among dataZoa accounts
And when you combine these possibilities in practice:
- Professors can share a curated dataset privately with students
- Students can email a quick chart to professors and ask questions
- Researchers in different locations can use dataZoa as a common data repository
- Data-driven papers can be presented entirely wthin in a dZBoard
- A graduate can pull up dZ-driven work on a smartphone in the middle of an interview
- A dZChart, via SMS
- Emailing a chart
- A dZBoard - California Energy
- A multimedia dZBoard - State of Maine
Some sample projects:
| Heart Attack Outcomes Related to Type of Insurance | Strength of the Ruble and World Oil Prices |
| Lobbying Expenditures and the Supply of US Physicians | A Job Search Analysis |
Getting dataZoa for your campus
How does a datazoa subscription work?
- Single low-priced annual subscription
- Licensed campus wide, based solely on access to your ".edu" domain
- Flat rate for entire campus
- All-inclusive - no upcharges for data or usage
- Unlimited Student-level accounts
- Training
- Webinars
- Self-guided videos for dataZoa and various data sources
- Telephone support as needed
- Turn-key Deployment Kit for your Library Web Pages
- Fulsome descriptions of dataZoa's capabilities
- Drop-in self-serve links for creating accounts
- Keyword list for catalog search engine, linking dataZoa to relevant databases and subject areas
Company Home Page
Key Company Milestones